Preseason Projections: More Relevant Than You Think
Baseball fans often express their dissatisfaction with projections, a sentiment that is hardly surprising given the inherent uncertainty in these forecasts. Projections come with large error margins, and they can sometimes seem to unfairly criticize players that fans hold dear. Interestingly, the peak of complaints tends to occur during the stretch run of the season rather than at the beginning. Many fans voice frustration not just about projections that miss the mark, but also about the perceived sluggishness of in-season projections to adjust based on player performance. For instance, a player with a .500 slugging percentage may still be projected to finish the season at only .400, leading to the conclusion that projections are too slow to adapt.
Ben Clemens has conducted extensive audits of playoff odds, revealing that while these calculations may not be flawless, they are quite reliable. The core of these calculations relies on a blend of preseason projections and in-season performance data. This raises an important question: how much should a few months of performance alter our initial perceptions of a player established in March? The answer, as it turns out, is less than many fans might expect. According to the ZiPS system, preseason projections for both teams and individual players are more predictive of rest-of-season performance than the statistics accumulated during the season itself. This trend holds true even late in the season, when a significant amount of performance data is available. In fact, tests conducted as late as September 10 show that preseason projections consistently outperform in-season stats.
Gear for the Game
Sponsor success. Continue reading:
To illustrate this point, let’s examine team projections. One might assume that team performance data would outperform preseason projections, given that they incorporate real-time information about roster changes and injuries. ZiPS has been generating team projections since 2005, and after excluding the shortened 2020 season and the ongoing 2026 season, we have 600 projected team winning percentages to analyze. When comparing preseason projected winning percentages to actual results through August 31, the preseason projections were closer to actual September results 309 times out of 600, or 51.5% of the time. While this indicates a slight edge for preseason projections, the season-to-date numbers had a marginally lower mean absolute error.
Looking ahead to the following season, the ZiPS projections regain an advantage over both the season-to-date results and the full-season results. This suggests that if one were to project the 2027 season using only the 2026 ZiPS preseason standings, the projections would likely yield better outcomes than relying solely on the actual results from the previous year. In fact, preseason ZiPS projections win 52.8% of these next-year comparisons, with lower mean absolute error and root mean square error than the full-season data.
Preseason projections still matter for players
When analyzing individual players, the data from 2004 to 2025 shows that preseason ZiPS projections slightly outperform season-to-date numbers in terms of wRC+, with a 50.4% success rate. The same trend is observed for pitchers, where ZiPS projections excel against season-to-date numbers in ERA+, winning 55.3% of head-to-head matchups. This indicates that even as players age and their performance may fluctuate, preseason projections still hold significant weight in forecasting future performance.
However, it’s crucial to clarify that this doesn’t mean that in-season performance is irrelevant. By September, we have a wealth of information about player health and team capabilities that we didn’t possess in March. In-season projections do incorporate this new data and do adjust accordingly, but they may not shift as dramatically as fans might hope.
Recency bias plays a significant role in how we perceive player performance. For instance, witnessing Otto Lopez maintain a .305 batting average throughout the season can create a strong impression of his abilities, overshadowing the more conservative projections generated earlier in the year. Similarly, while Jordan Walker’s breakout season may suggest he’s a star in the making, projections still place him in the 105-110 wRC+ range going forward. This highlights the importance of not discarding the broader context provided by preseason projections, which are informed by years of player development and performance history.
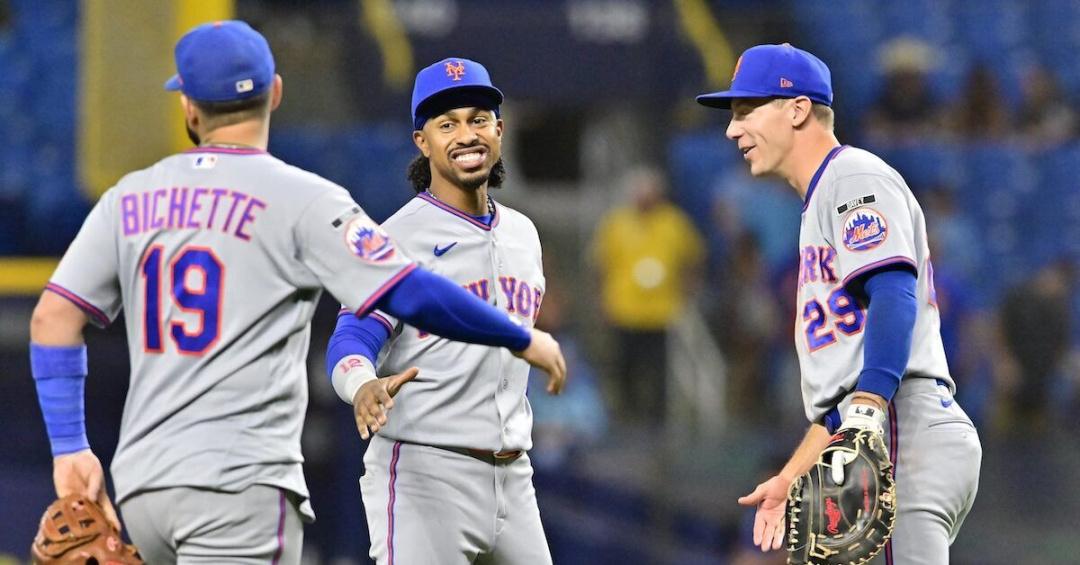
Teams like the Mets, Orioles, Blue Jays, and Tigers have all underperformed relative to preseason expectations, yet they have shown signs of improvement since the trade deadline. This suggests that the initial assessments of their talent may have been accurate, and that poor performance in the first half of the season does not negate the value of preseason projections. Ultimately, while baseball seasons are significant because they reflect actual outcomes, preseason projections remain a vital tool for understanding what might come next in the unpredictable world of baseball.